Edkimo offers you various editing as well as presentation options of your results. Depending on the question type used and whether it is a closed or open question, the results are displayed differently. If you have used a template from the Edkimo library for your survey, there is usually a text summary and breakdown of results into areas. This is followed by the evaluation of the individual questions. Surveys with your own templates start directly with the evaluation of the individual questions.
Settings and usage options in the results view
In the results view, there are various settings and usage options.
Settings are:
- Share results with the group or, in the case of Edkimo Teams users, only with the team admin. In the default setting, the results are only visible to you (“Private”).
- Show or hide answers of free text questions (also affects sharing).
Usage options are:
- “Refresh” brings the results up to date without having to reload the page.
- “Notes” make own comments possible.
- “Print” allows you to print out the results (not optimized).
- With “Archive” you can move the results of the survey into the archive.
As a premium user you can also:
- Filter your results by subgroups in “Filter”.
- Download the results of your survey in “Data export” in different file formats (PDF / CSV / EXCEL).
Furthermore, the key data of the survey will be displayed as:
- Title of the survey
- How many responses have been received
- Date and time of the latest response
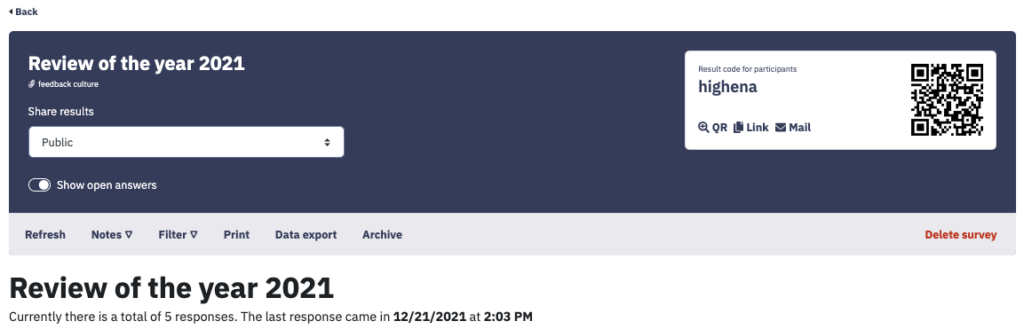
This is how the results screen look like at Edkimo
If you scroll down further, the results of your survey will be displayed.
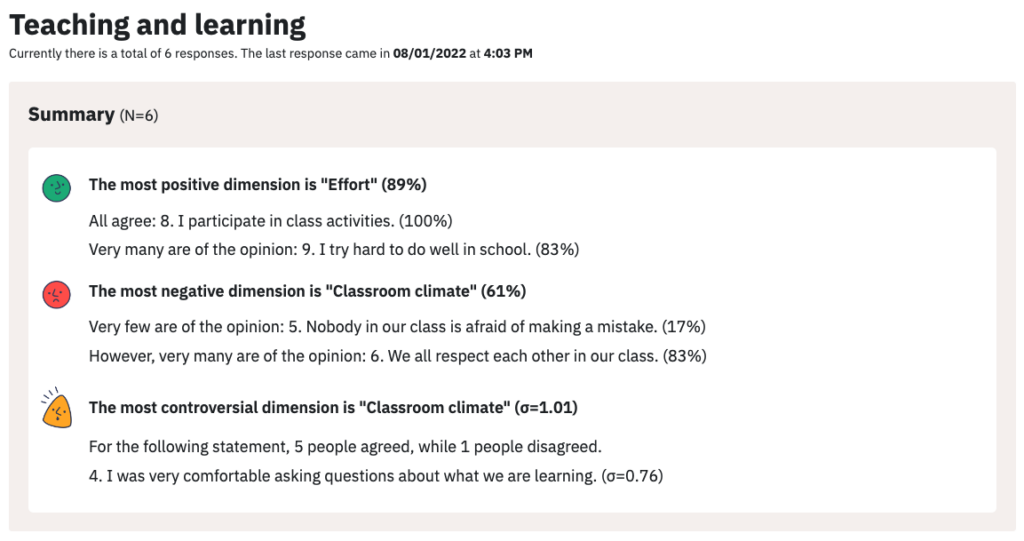
Text summary
First you will see a text summary. This is divided into three sections. You see at one glance:
- The area of greatest agreement.
- The area of lowest agreement.
- The area with the greatest dispersion.
Summary of the results by area
The various questions of one area of the survey are summarized as a bar chart.
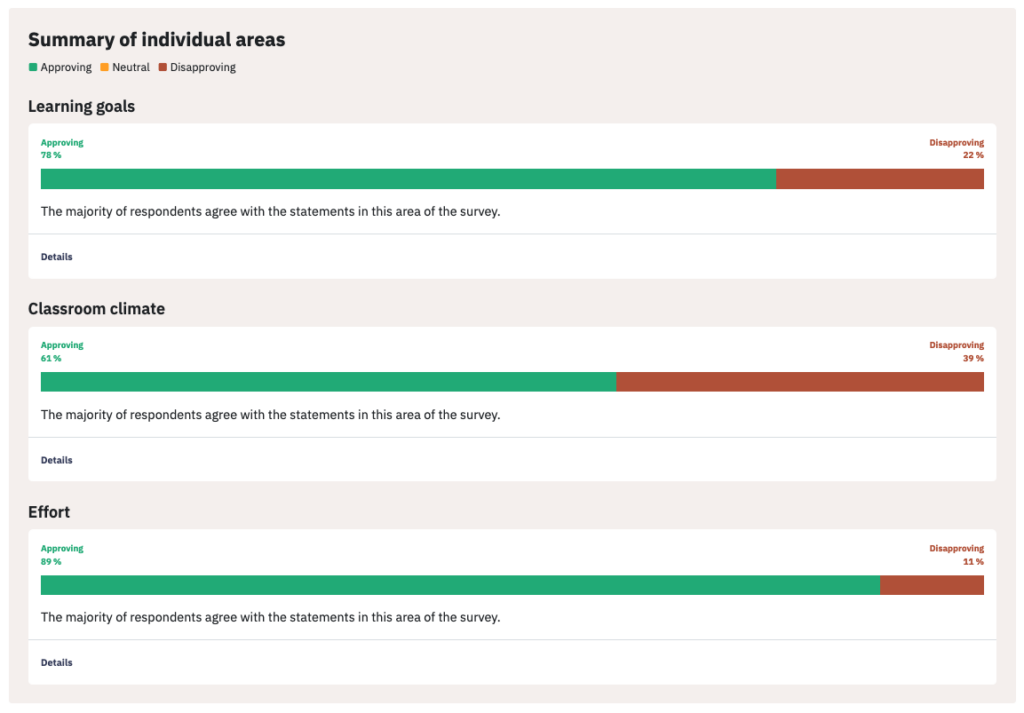
Via the “Details” button, you can take a closer look at the individual area.
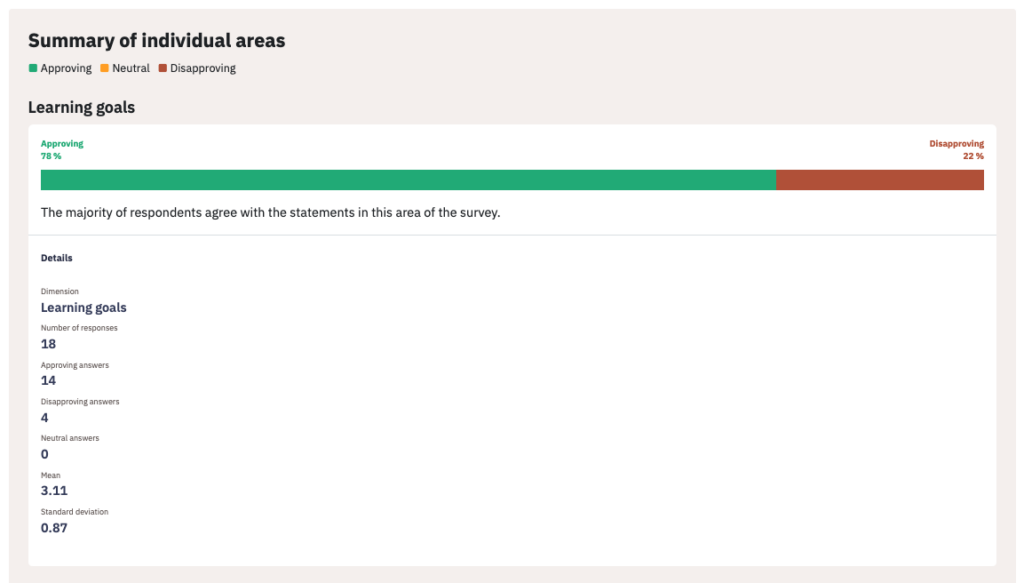
Single frame results
Finally, the results of the individual questions are presented one by one. Below all questions you will again find a “Details” button with the statistical key figures.
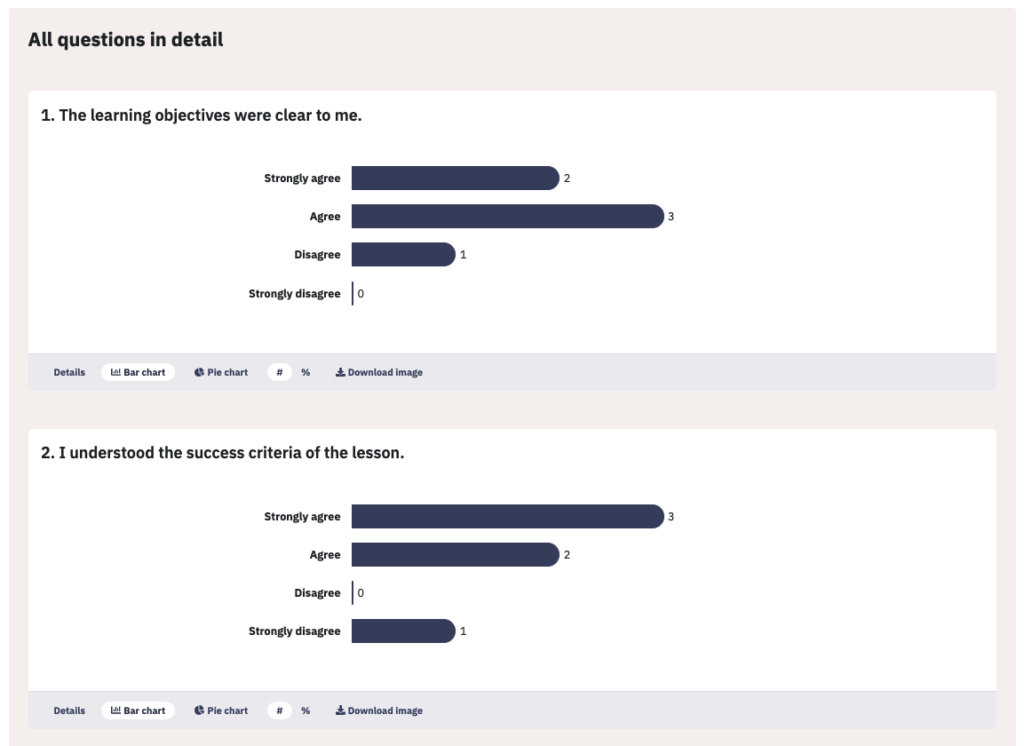
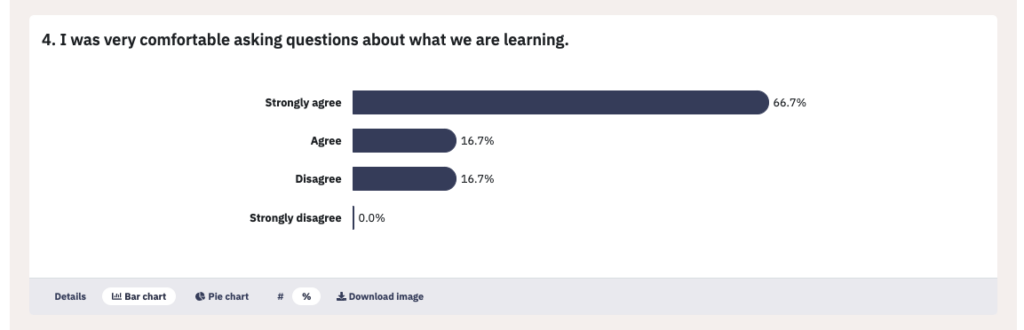
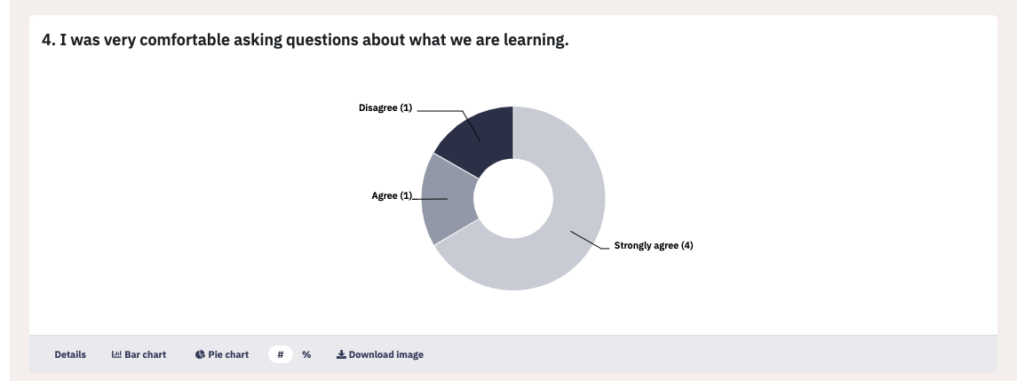
In addition, depending on the question type, you can view the result in other formats under the respective results:
- Bar chart and pie chart, each in absolute (#) and percentage (%) numbers:
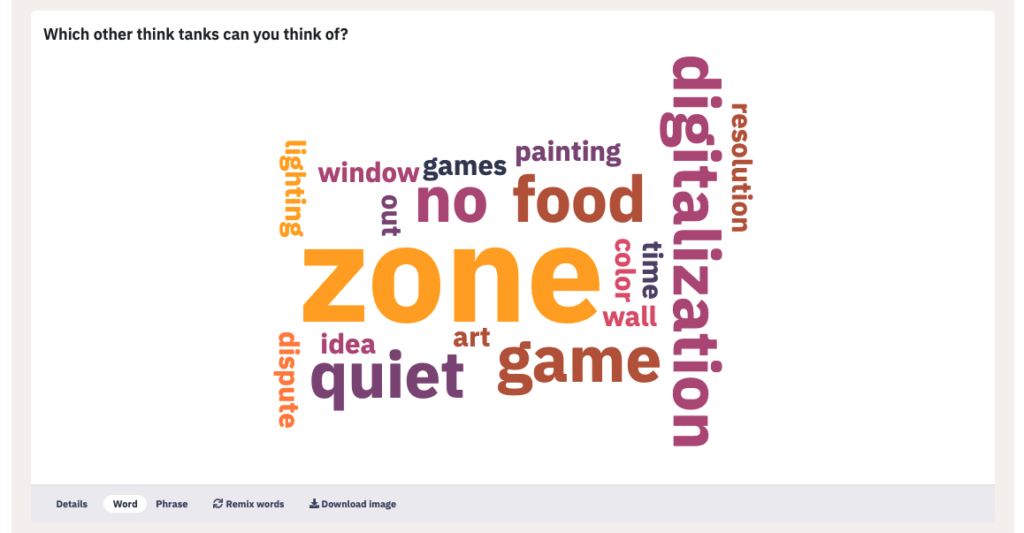
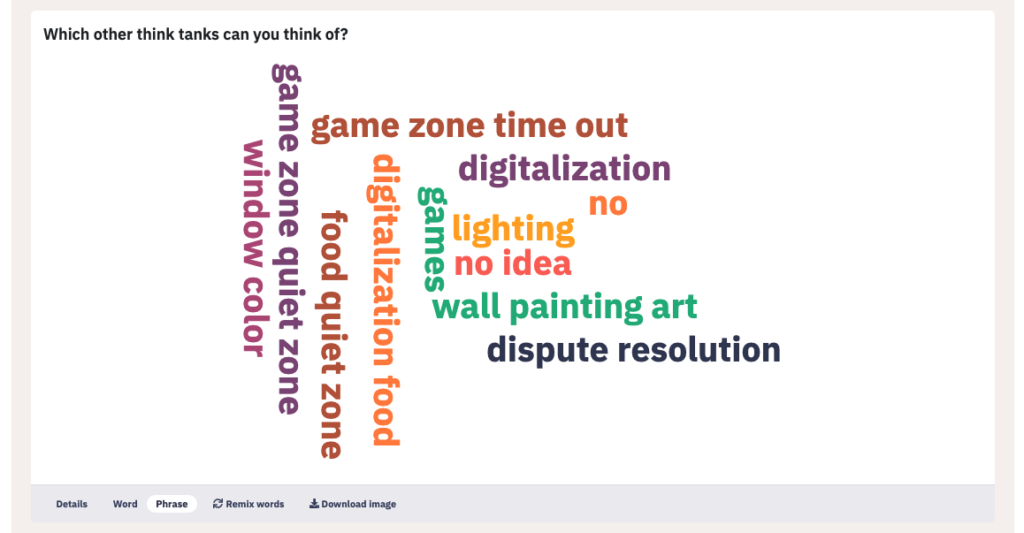
- Free text, with the possibility to show the date of the feedback and switch to the “Word cloud” display.
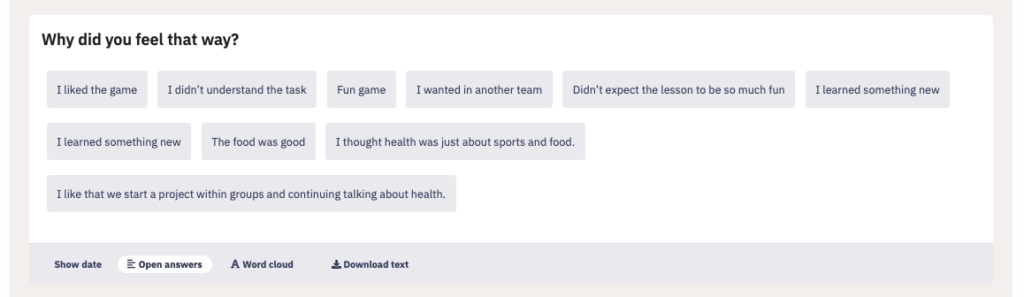
- Word cloud, with the option to separate words or phrases, i.e. to display feedback with more than one word contiguously.
Premium users can also download the individual questions as an image or text file, e.g. for use in a meeting or presentation.